We are starting to see some investment opportunities materialize. However, quantifying these opportunities remains challenging as the current landscape is shaped by high interest rates, future economic uncertainty, and waves of new supply.
While there is no question that the future supply pipeline is dwindling due to high financing costs that are reducing the feasibility of new development projects, aassessing today’s opportunities requires the ability to determine the timeline for absorbing near term new deliveries, and accurately predicting the impact on rents, concessions, and vacancies.
Many properties are experiencing higher vacancies due to increased supply and competition. While this is good in the sense that this reduces NOI and does provide the opportunity to purchase at a discount relative to where we were two years ago. This discount is only relevant if vacancies start to decrease in the future.
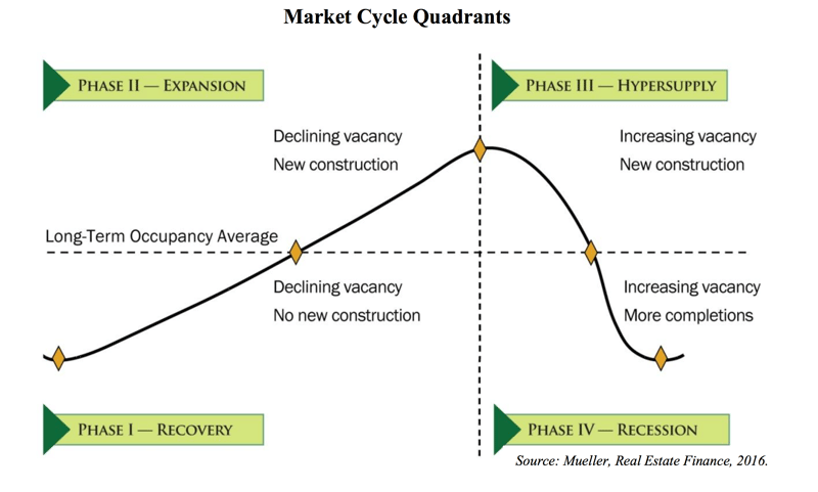
Where are we in the market cycle?
If we go back to the fundamentals of the market cycle. The cycle is driven by new supply, and the impact of this supply is measured in terms of occupancy. Where you are in the cycle is determined by the direction of the occupancy trend – if you are above or below the long-term average occupancy, and if there is new construction in progress or being delivered.
Right now, for most major markets, there are currently new deliveries being brought to market with a few more projects in the pipeline. However very few markets have a very robust pipeline of future deliveries.
Given the high cost of capital, and the long timeline needed to get a development project from business plan to lease up, we expect that the next 24-36 months will have very little new supply in most markets.
This supply profile puts us in either Phase3 or Phase 4 for most markets. Looking at occupancy and rents, most major markets are experiencing declining occupancy, and declining rents. And if you are in a market where occupancy is below the long term average, you may already be in Phase 4.
This is the theoretical bottom; which represents the lowest pricing point that we are going to get.
This is where the really good deals are bought if you are brave enough to step out into the market and buy at a time when everyone else is paralyzed by uncertainty.
While we don’t suggest trying to time the exact bottom, it is good to have a sense of the direction of the market cycle, and how fast the cycle is moving. Buying the dip is good, but you don’t want to be waiting for recovery for 5 years either.
Understanding Occupancy trends
Below you can see a chart for our sample market, which shows that vacancy today has increased 2.6% year-over-year, pushing occupancy down to the long term average, and forecasted vacancy (8.6%) is pushing occupancy below the long term average (7.8%).

Looking at deliveries, you can see that current deliveries (292) exceed the long-term average (181), and forecast deliveries (159) are below the long-term average.
This means we are in Phase 4 of the market and moving towards Phase 1. This potentially creates a great buying opportunity, as we know that pricing will be at its low point. The key question is “when exactly will we see the Phase 1 recovery?”
The simple answer is that we will see it when current occupancy is below the long term average, and the forecast occupancy is above the long-term average. However, the problem with an efficient market is that when the data clearly shows market recovery, pricing will already have corrected.
The longer answer to this question, and one that better allows you to see opportunities before everyone else, is to look at the projected inventory and try to determine a rate of absorption based on demand and absorption rates.
Using supply and absorption to forecast opportunity
Currently this submarket has negative absorption. This means that new deliveries (12 month = 292, forecast = 159) have pushed the market into oversupply and there is not currently enough demand to absorb the increased inventory (12 month absorption = -58, forecast = 124). This is reflected in the increased vacancies and negative rent growth.
If we expand our view to the broader market, the table below shows that we are expecting to see 787 new deliveries between now and 2028. In that time, population is expected to grow by 2,300.
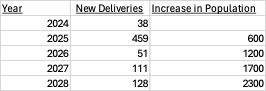
While new deliveries are projected to continue, the velocity of deliveries does not keep pace with the projected increase in population. By 2026, we expect that demand will significantly outpace the available supply.
Now, of course there are additional complexities involved. For example, we cannot tell how much of the projected new population will be renters versus owners. However, we can easily see that the demand pressure in future willl begin to outpace supply.
Conclusion
The next period will potentially present some of the best buying opportunities that have been sseen in a long time. Now is the time to look for opportunities, as most markets will be pushing into the recession phase of the cycle, where prices are likely to be at their low points, while the uncertainty associated with higher vacancy, lower rents, and high financing cost may cause many of these opportunities to be overlooked.
The investors who are able to find the deals and correctly assess where weaker market forces are temporary, will be the ones to make outsized returns as we make our way through yet another cycle.
To learn more about how we can help you to generate superior investment results through professionally managed Real Estate investments, click here to register for our investor club.