It seems that most in the industry are now less optimistic about the Fed reducing interest rates in a meaningful way in 2024.
The market often overreacts to news, and the optimism that was felt late last year about a Fed-pivot is reverting back to some level of uncertainty.
We are also in an election year, and many believe that the Fed attempts to be less active in an election year. This suggests that we may only start to see rate reductions later in the year, and perhaps only one or two small rate cuts at best. While this would be welcome news for many real estate investors, it will hardly have a material impact on changing the landscape in the short term.
So, what will it take for the Fed to start to reduce rates? Well, they continue to say that they will be driven by the data. They want to see inflation fall closer to their 2% target (CPI in January was 3.1%). They will also be closely looking at the unemployment rate and any signs that the job market is starting to deteriorate. The problem is, headlines will say that the job market is currently strong, but that’s not necessarily the case.
U-3 Unemployment
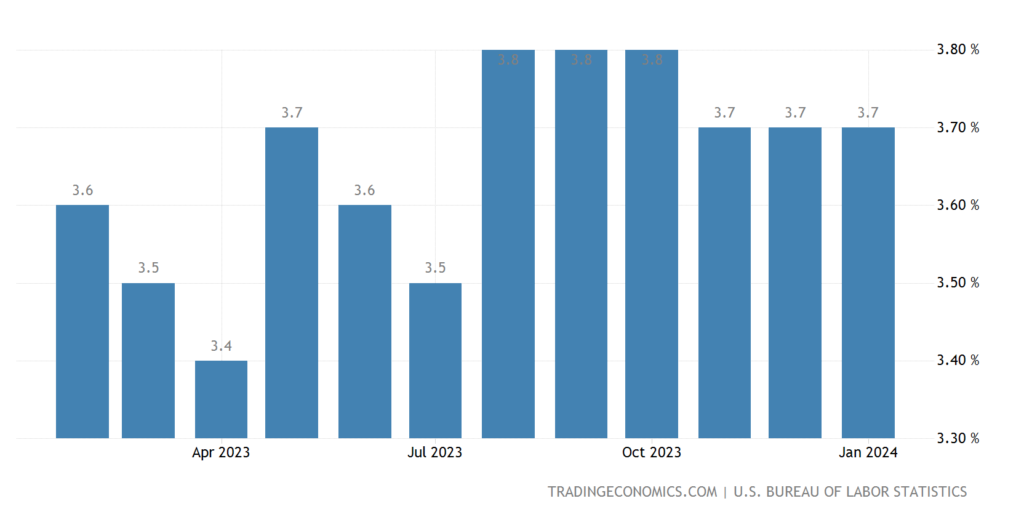
The official measure of unemployment – the U-3 Unemployment Rate – gets plenty of media coverage. The current unemployment rate using this measure is 3.7%. When the statistic is below 5%, it is commonly considered to show a rosy picture for the economy.

However, this measure of unemployment has a number of known flaws and is often criticized for understating the level of joblessness, because it includes only people who are actively seeking employment.
This statistic measures the number of people who are jobless but actively seeking employment in the last four weeks. The rate is measured by the BLS, which contacts 60,000 randomly selected households across the country and records the employment status of each person 16 years old and older.
However, here are some of the limitations with this approach:
- Unemployment doesn’t account for discouraged workers. These are adults who have looked for work at some point in the past 12 months, but not in the last four weeks.
- Unemployment ignores other marginally attached workers. For example, you may have been looking for a job for a while, but then stopped looking recently to care for a sick parent. In this instance you would not be considered unemployed.
- Unemployment doesn’t consider the quality of jobs that workers have. The official rate does not differentiate between part-time and full-time work, nor does it consider whether people have low paying jobs. It overlooks the fact that some workers may have taken a part-time or a low-paying job temporarily, just to put food on the table.
So, although the Fed and many economic commentators may be watching this statistic, we should be questioning whether it really is the best indicator to give us a sense of the state of the job market and the wider economy.
U-6 Unemployment: The Real Unemployment Rate
Many economic experts instead focus on what’s known as the real unemployment rate. This measure is reported on a monthly basis within the jobs report. Unlike the official unemployment rate, however, it does take underemployed and marginally attached workers into consideration.
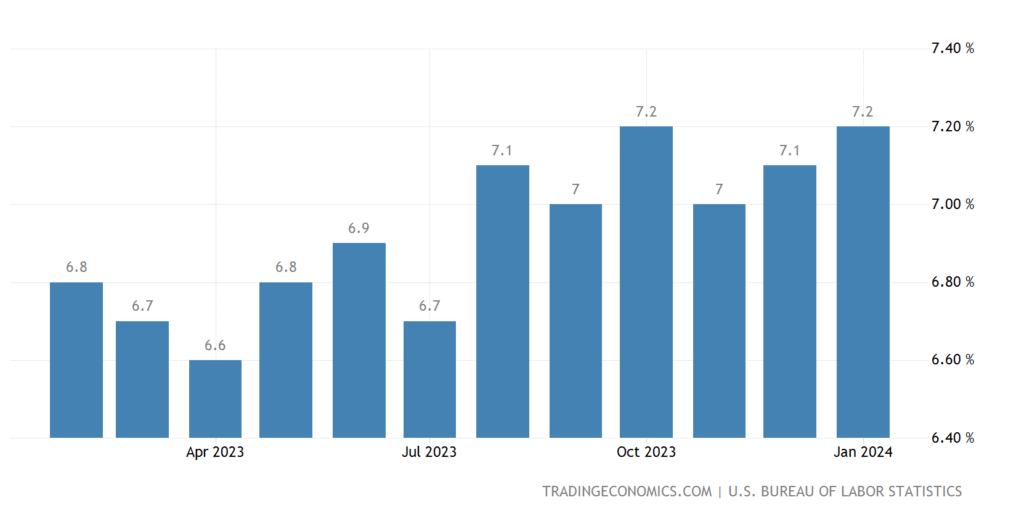
The current unemployment rate using this measure is 7.2%, and interestingly, this measure has been deteriorating over the last 12 months, as shown below:

What insights can we draw from this, as investors?
The first insight is that the current state of the economy is probably not so rosy. We are already feeling this in the day-to-day operations of our business. Renters have been struggling with a higher cost of living for a while now and we are seeing that it is harder to continue to push through rent increases, without suffering from increases in vacancy or bad debt.
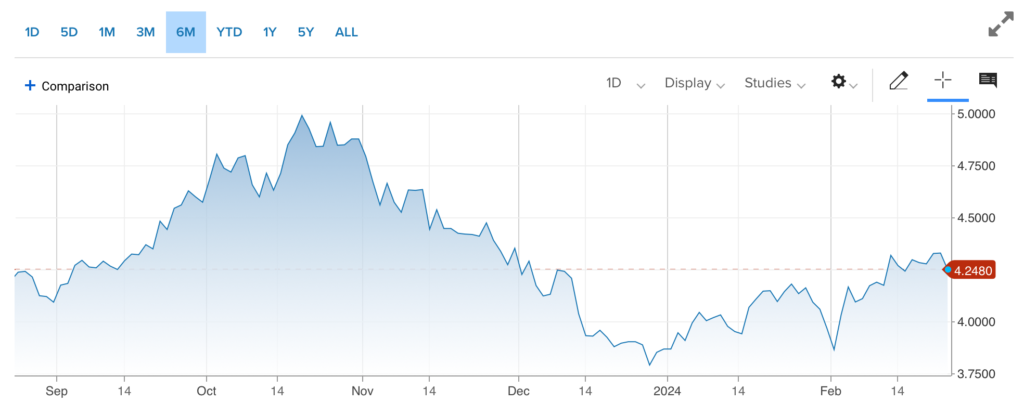
We also continue to face uncertainty and volatility from an investment perspective. The yield on 10-year treasuries have increased since December, from a low of 3.785%, to a current rate near 4.25%. This not only increases our cost of capital. The volatility in this rate also makes it extremely challenging to underwrite new deals and creates the potential to mis-price new deals, both on the low side and on the high side.

Perhaps a silver lining with all of this is that this continued uncertainty may encourage the money on the sidelines to continue to sit tight.
With the Fed pivot, there was always the chance that the dry powder on the sidelines would all come tumbling back into the market at the same time and make it very challenging to find and win new deals. This may create opportunities for willing buyers in the short term, as long as we are prudent with our assumptions about organic rent growth, vacancy and bad debt in the short term, and as long as we are careful with assumptions regarding the cost of capital.

To learn more about how we can help you to generate superior investment results through professionally managed Real Estate investments, click here to register for our investor club.

Thank you for sharing this insightful article! I found the information really useful and thought-provoking. Your writing style is engaging, and it made the topic much easier to understand. Looking forward to reading more of your posts!